· 4 min read · Market UpdateProsper TX
Prosper, TX Real Estate Market Update: July 2026
What happened in the Prosper, TX, housing market in July 2026: median price of $800,000, 382 active listings, 38 days on market, and what it means for buyers and sellers.
Want the latest numbers instead of a snapshot? See my live Prosper & Celina market data page for real-time inventory, prices, and days on market pulled directly from NTREIS MLS. This post is a monthly interpretation of those trends.
July brought a small but meaningful shift in Prosper. Homes sold faster than they did a year ago, prices held nearly flat, and inventory kept building. Here's what that means if you're buying or selling right now.
The headline
Median price in Prosper came in at $800,000 in July, up just 0.6% year-over-year for single-family resale homes. Median days on market fell to 38, down 7 days from last year, while active listings climbed 19.8% to 382. Sold listings totaled 61, down 8.9%.
That's a more balanced market than the headlines suggest: more homes to choose from, slightly fewer sales, and pricing that has essentially plateaued after several years of gains.
What changed from June
June's median price was $850,000 with a 41-day median and 386 active listings. July's numbers show the market settling rather than sliding. The month-to-month price dip reflects mix as much as anything: fewer $1M+ closings in the month pulls the median down without meaning individual homes lost value.
The more durable signals are the year-over-year ones. Inventory is nearly 20% higher than last July, and sales are down almost 9%. That combination is what's holding price growth near zero.
What buyers are seeing
- The widest selection in years. With 382 active listings, buyers can compare floor plans, lots, and builders across Windsong Ranch, Star Trail, and Light Farms without rushing.
- Well-priced homes still move quickly. A 38-day median means the best-priced listings are going under contract in two to four weeks. Speed hasn't disappeared — it's concentrated in homes priced at the comp line.
- Room to negotiate. With sales volume down and inventory up, closing-cost credits, rate buydowns, and repair concessions are realistic asks, especially on homes that have been listed 45+ days.
What sellers should know
- Flat is the new up. A 0.6% year-over-year gain means pricing off last year's peak neighborhood comp is a mistake. Price to what's closing today.
- Faster market, not a hotter one. Days on market falling to 38 is good news, but it's being driven by sellers pricing more realistically out of the gate, not by renewed bidding pressure.
- You have real competition. 382 active listings against 61 monthly sales is roughly six months of supply. Condition, photography, and pricing decide which homes get the showings.
The $4.5M sale I left out of these numbers
Note: I excluded this sale from the July stats above. At 29,000 square feet it's an outlier even for Prosper's luxury market.
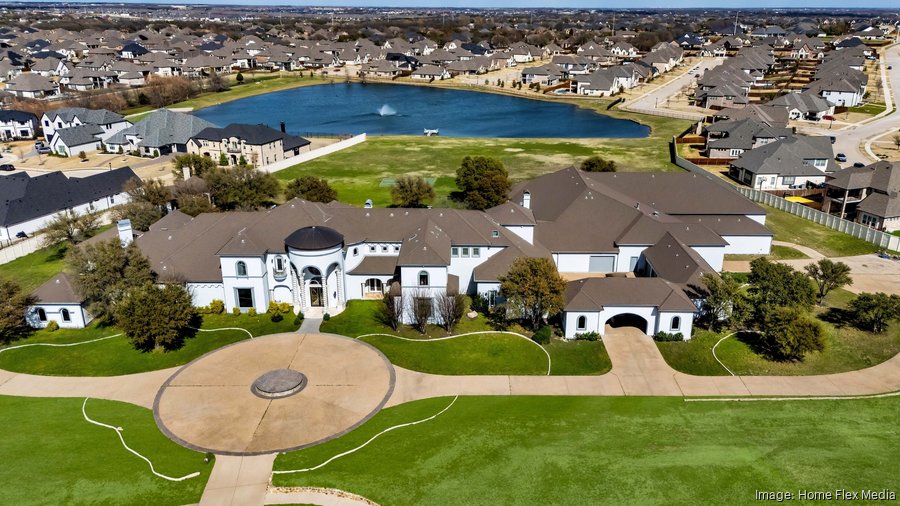
Deion Sanders' former Prosper mansion — known as "The Montclair" — sold on July 31, 2026, for $4.5 million. The estate was purchased by a married couple, Ervin Singh and Pooja Sharma, and was widely described as a "steal" given land values in Prosper.
Key details of the sale
- Final sale price: $4.5 million
- Listing history: Originally listed in April 2025 for $5.5 million, later reduced to $4.995 million
- Condition: Sold "as-is," with the new owners planning to renovate and restore the property
- Context: The seller was a Frisco-based LLC that bought the property in 2022; the home had been vacant since Sanders sold it in 2014
Property highlights
Located at 1400 Copper Point Dr. in Prosper, the mansion features:
- 9 bedrooms, 10 full bathrooms, and 2 half-bathrooms
- A 3,000-square-foot, two-story closet with a glass walkway
- A two-lane bowling alley, barbershop, indoor basketball court, home theater, and fitness center
- An 8-acre pond, outdoor pool, and 14-bay garage on 6 acres of land
The property sits within a development created after Sanders sold the original 100+ acre estate in 2014.
What I'm watching
Whether inventory keeps climbing into fall. If actives stay near 380+ while sales stay in the low 60s, buyers will gain further leverage heading into the slower winter months — particularly above $1M, where the pool of qualified buyers is thinnest.
Want a custom report for your home or street?
If you'd like a free, no-pressure market analysis for your specific address, including recent sales, current competition, and a realistic pricing range, call or text Anne at 945.302.1437 or request a home valuation. You can also explore the live Prosper & Celina market data for up-to-date MLS charts.
Anne Cicero is Realtor® with Monument Realty in Prosper. She and her family have called Prosper home since 2019.
Source: MetroTex Association of Realtors®. Data reflects single-family resale, percent change compared to prior year.